If you’re in sales or marketing, you’re constantly on the lookout for ways to improve your team’s effectiveness. One of the most effective ways to achieve this is by leveraging firmographic data. In this blog post, we’ll explain what firmographic data is, why it’s important, and how you can use it to boost your sales and marketing efforts.
What is firmographic data?
Firmographic data is company-level information that B2B sales and marketing teams use to find and target their ideal customers. The fields you’ll see most often are industry, company size, revenue, location, ownership structure, and growth stage. If demographic data describes people, firmographic data describes the companies they work for.
The definition is the easy part. The data underneath usually isn’t.
Most firmographic data on a commercial dashboard is older than buyers think, more estimated than verified, and noticeably weaker outside the US than the headline record counts suggest. Knowing what the term means is straightforward. Knowing what’s in your database is the part that affects pipeline.
Firmographic data examples
These are the standard fields, with what’s worth knowing about each:
- Industry classification. The codes a database uses to label what a company does. NAICS (North American Industry Classification System) in the US and Canada, ANZSIC (Australia and New Zealand Standard Industrial Classification) in those two markets, JSIC (Japan Standard Industrial Classification) in Japan, MSIC (Malaysia Standard Industrial Classification) in Malaysia, SSIC (Singapore Standard Industrial Classification) in Singapore. The system should match the market you’re selling into. Running NAICS codes against an Australian database is rough translation, not accurate classification.
- Company size and revenue. The two most-cited attributes. Public companies disclose both. Private companies usually don’t, so most databases estimate, and the estimation methods (and the numbers) vary widely. A company listed at “10,000 employees” globally might have 50 staff in the market you sell into. More on why global headcount can undermine your outbound activity.
- Location. HQ (headquarters), branches, regions served. Useful for territory planning. Less useful for scoring an ICP (ideal customer profile) than most teams assume.
- Ownership structure. Public, private, PE-backed (private equity), founder-owned, subsidiary, franchisee. Often the most operationally useful firmographic attribute, and the one global databases handle worst.
- Founded date and growth stage. Founded date is stable. Growth-stage attributes (Series A, B, C, late-stage) decay fast and need continuous monitoring.
These fields look uniform across providers. They aren’t. The accuracy gap between providers on the same field is often the difference between a working outbound program and one that quietly burns budget.
What do sales teams use firmographic data for?
Five jobs, in roughly the order they create business value:
- Defining the ICP (ideal customer profile). Setting the firmographic boundaries of your ideal customer profile so the rest of your go-to-market (GTM) machine has a target to aim at.
- Sizing the TAM (total addressable market). Counting how many companies match your ICP.
- Territory planning. Slicing the TAM by region, vertical, or company size so reps know which accounts belong to them.
- Lead scoring and prioritization. Combining firmographic fit with intent or signal data to decide which accounts get worked first.
- Personalization. Tailoring the pitch by industry, size, or growth stage.
If you’re running account-based marketing (ABM), the first three are non-negotiable. If you’re running high-volume outbound, all five matter. Either way, firmographic data is the foundation, not the finish line. The finish line is the company being a genuine fit for what you sell. Firmographic data is one input to that judgment.
Firmographic vs technographic vs intent data
Three data categories that work together. The lines get blurred in vendor marketing, so it’s worth being precise:
| Data type | Answers the question | Examples | Decay rate |
| Firmographic | Who is this company? | Industry, size, revenue, location, ownership | Slow on most fields, faster on headcount and revenue |
| Demographic | Who is this person? | Name, title, seniority, function, contact details | Job titles change at around 2% per month |
| Technographic | What technology does this company use? | CRM (customer relationship management), marketing automation, security stack, cloud provider | Two to three times faster than firmographic |
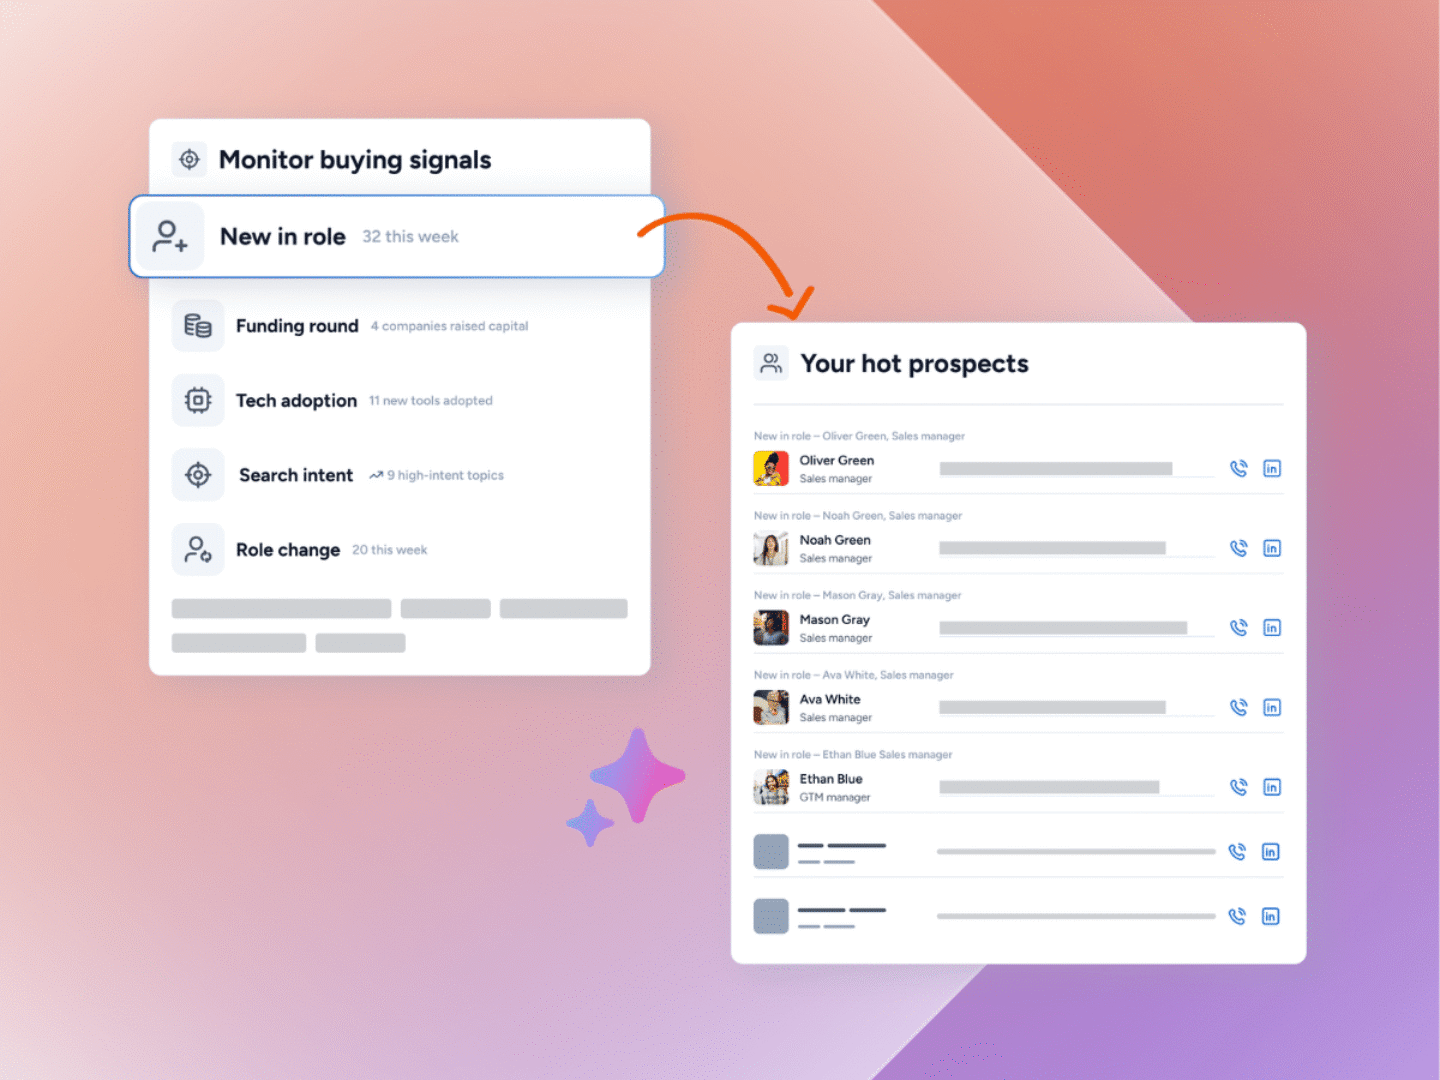
| Intent / signal | What is this company doing right now? | Search behavior, role changes, funding rounds, hiring activity | Signals expire in days or weeks |
The combination matters more than any single category. Firmographic data qualifies fit. Technographic data qualifies operational compatibility. Intent data qualifies timing. Scoring leads on firmographic data alone is a common mistake. A perfect firmographic fit with no current intent signal is a nurture account, not a priority.
Where does most firmographic data fall short
The B2B data market was built on the idea that firmographic attributes are universal. Industry codes, headcount, revenue, location: same shape in every market, same database for every buyer. That’s still how most major data providers operate, and it’s why their data quality is uneven in ways most buyers under-appreciate.
Two specific weaknesses show up consistently.
Local data is shallow
The fields look the same in every country. The data underneath them does not.
A US database can read NAICS codes from filings with the SEC (Securities and Exchange Commission). An Australian database needs ANZSIC codes registered with ASIC (Australian Securities and Investments Commission). A Singapore database needs SSIC from ACRA (Accounting and Corporate Regulatory Authority). A Malaysian database needs MSIC from SSM (Suruhanjaya Syarikat Malaysia, the Companies Commission of Malaysia). The codes aren’t interchangeable, and rough translation produces wrong segments.
Ownership structure has the same problem. Australian franchisee networks are operationally separate but legally connected. A global database tends to handle them in one of two unhelpful ways. It either merges them entirely (and loses the local decision-maker) or treats them as fully separate companies (and loses the parent relationship). Indonesian holding companies, Malaysian Sdn Bhd structures, and Hong Kong subsidiaries of mainland Chinese parents create variations on the same problem.
Director information, current ownership, and refresh cadence are also weaker outside the US. Local company registers publish all of it. Most global databases don’t ingest it at meaningful frequency.
If you sell anywhere outside the US, this is the dominant data-quality variable. A provider with 100 million global records and weak local depth will lose to a provider with 3 million high-fidelity local records, every time, on outbound that actually converts.
Firmable’s APAC (Asia-Pacific) dataset was built around this, drawing on hundreds of local sources with entity resolution that handles the structures global databases miss.
Vertical-specific firmographics are missing
The second gap shows up when sellers move into specialized verticals.
Standard firmographic data tells a cybersecurity seller that an account is in healthcare. It tells them nothing about the company’s security posture, exposure history, or regulatory status. A healthcare seller gets “industry: healthcare” and stops. What they actually need is bed count, EHR (electronic health record) platform, payer mix, and accreditation. A construction seller needs active project data and contractor licensing. A financial services seller needs charter type and regulatory exposure.
None of this lives in a standard B2B database. It’s being built by specialist providers, and the buyers who need it are increasingly going there directly.
Firmable’s North America launch was built around this, starting with IT Managed Services and expanding into other specialized verticals from there.
What this means for buyers in 2026
If you’re evaluating firmographic data providers right now, the questions to ask are different from five years ago.
Back then the question was “how many records do you have?” Today it’s three different ones:
- For non-US markets: How is your local data built, and from what sources? Is the industry classification native to the market, or translated from NAICS? How do you handle local entity structures?
- For specialist verticals: What vertical-specific attributes do you carry beyond the standard fields? How often is that data refreshed?
- For everyone: What percentage of your data is verified versus estimated? For private companies, how are headcount and revenue calculated? What’s your refresh cadence at a record level, not a database level?
A provider that wins on horizontal global firmographics in 2026 is mostly winning on price, not on data. Providers that win on local depth or vertical depth are winning on data quality. The buyers they serve see better outbound performance as a result.
Frequently asked questions
Firmographic data is company-level information B2B sales and marketing teams use to identify and segment businesses. It includes industry, company size, revenue, location, ownership structure, and growth stage. It’s the company-level equivalent of demographic data, and it sits underneath any ICP, TAM analysis, or account-based marketing program.
Standard firmographic fields include industry classification (NAICS, ANZSIC, SSIC, SIC), company size (headcount and revenue), location, ownership structure (public, private, private-equity backed, subsidiary, franchisee), founded date, and growth stage. More specialized firmographic attributes are showing up for vertical use cases like healthcare bed counts or financial services charter types.
Firmographic data describes who a company is (industry, size, revenue, location). Technographic data describes what technology a company uses (CRM, security stack, cloud provider). Firmographics qualify fit. Technographics qualify operational compatibility. They work together: firmographic data sets the target universe, technographic data narrows it.
Firmographic data is static. It describes who a company is. Intent data is behavioral. It describes what a company is doing right now: researching solutions, visiting product pages, hiring for specific roles. Firmographic data answers the fit question. Intent data answers the timing question.
Firmographic data comes from a mix of public company registers (ASIC, ACRA, SSM, the SEC), private filings, company websites, social platforms, and third-party data providers. The leading B2B databases aggregate these sources and apply entity resolution to merge related records. Quality varies sharply based on how much of the data is verified at source versus modeled from secondary signals.
Accuracy depends on the field, the market, and the provider. Stable fields like industry classification and founded date are usually reliable. Headcount and revenue for private companies are often estimated and can be significantly wrong. Ownership and entity structure data is reliable in markets where the provider integrates local company registers, and weak where it doesn’t. An accuracy claim of “95%+” should always be unpacked: 95% of which records, on which fields, by what definition?
Three options. Direct collection from public company registers is free but high-effort. Specialist data providers focused on specific markets or verticals deliver depth where it matters. Major global B2B databases offer breadth at the expense of local and vertical depth. The right choice depends on where you sell and what kind of depth you need. For most teams selling outside the US enterprise market, a provider with strong local or vertical depth will outperform a larger global database on outbound conversion.
See firmographic data built for the markets and verticals you sell into
Firmable’s B2B sales intelligence platform runs on locally sourced firmographic data across APAC and vertically deep firmographic data for specialist sellers in North America.
Start a free trial and see how the data looks in your target market. Or talk to our team if you want to walk through what local or vertical depth could mean for your outbound prospect lists.
Firmable is ISO 27001 certified, trusted by more than 1,000 companies worldwide, and rated 4.7 stars on G2.